
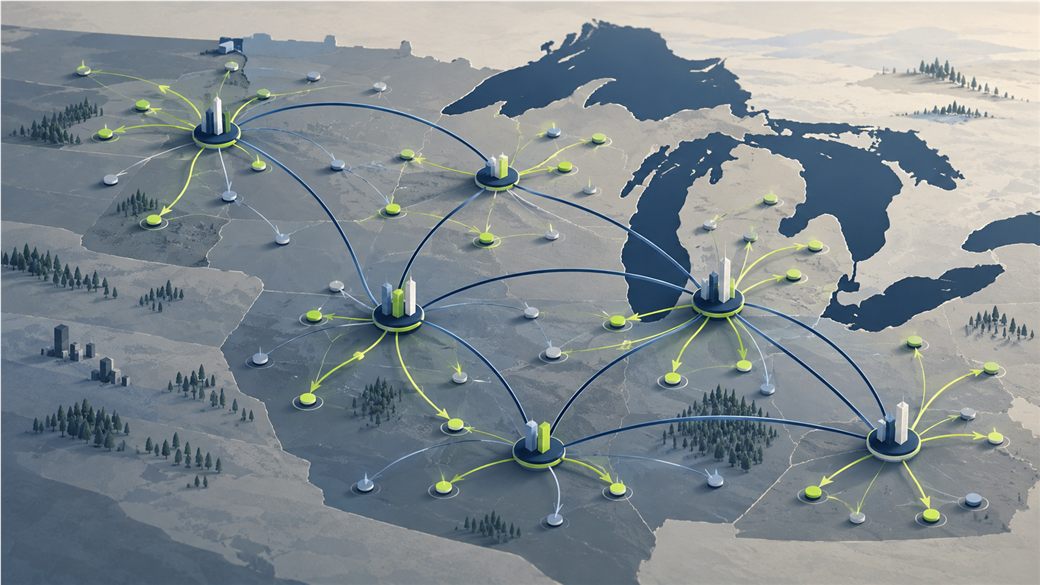
Where a fund is based, where a company is built, and where a round is financed are related but different facts. The available six-state data quantifies only part of that map: the location of companies in reported rounds. It does not identify the domicile of every investor or the path each check traveled.
In Q2 2026, companies across the six states tracked by Start Midwest completed 114 reported funding rounds, or 6.0% of the national deal count. Those rounds carried $1.27 billion, or 0.90% of reported US funding dollars.1 Deal share was close to the year-earlier level; dollar share was not.
Start Midwest-reported fundraising · six states · USD billions · Q2 2025–Q2 2026
| Quarter | Reported funding (USD billions) |
|---|---|
| Q2 2025 | $3.70 |
| Q3 2025 | $1.21 |
| Q4 2025 | $1.03 |
| Q1 2026 | $1.10 |
| Q2 2026 | $1.27 |
Bars begin at zero and scale to the largest quarter shown. Q2 2025 included a $2.1B Acrisure financing; Q2 2026 included a $650M Slate Auto financing and a $67M Spectrum Brands public-company convertible note that the publisher chose to count and label. Timing, classification, and individual rounds can change the totals.2
Why the Two Maps Diverged
Deal activity can continue while the largest checks cluster elsewhere. Start Midwest reports that one Michigan financing supplied more than half of the six-state Q2 2026 total. The five-quarter exhibit shows the same sensitivity in reverse: one $2.1 billion financing helped lift Q2 2025 far above the four quarters that followed.2
Company formation has dispersed. The capital that scales companies has not. Writing for Technical.ly in June on LinkedIn and Kauffman Foundation data, Christopher Wink put the mechanism plainly:
The cost of starting a company has dropped. The cost of scaling—in relationships, capital, and knowledge—may be as concentrated as ever.
Christopher Wink, Technical.ly, June 7, 20263
His hedge is worth keeping; this is network measurement, not a settled law.
The Founder’s Side of the Gap
A founder does not experience a percentage. They experience the specific version of it: the warm introduction that cannot be manufactured, the partner meeting that requires a flight, the round that runs months longer than planned because the early conversations were with people learning the market from scratch.
In the second quarter of 2026, Midwest startups completed 114 reported rounds. That deal count is the steadier of the two series, since dollar totals swing on a single large check. Behind those 114 are 114 teams that answered the questions any investor would ask. Behind them is an unknown and larger number who never got the meeting where an investor’s questions get asked. Nobody can size that group from a map, and a share-of-dollars figure is not evidence that anything was mispriced.
A Wider Input Does Not Relax the Standard
A broader sourcing map does not relax the standard. Research on venture decision-making shows how much work sits between first sight and conviction.
In a survey of 885 institutional venture capitalists at 681 firms, Gompers, Gornall, Kaplan and Strebulaev reported the funnel behind one closed investment: 101 opportunities considered, 28 reaching a meeting with management, 10 reviewed with partners, 4.8 reaching due diligence, and 1.7 receiving a term sheet. A wider map multiplies the first number. It does nothing to the four that follow.
Bar widths are proportional to the counts reported by the authors.
| Stage | Opportunities per closed deal |
|---|---|
| considered | 101 |
| met management | 28 |
| reviewed with partners | 10 |
| reached due diligence | 4.8 |
| offered a term sheet | 1.7 |
Source: Gompers, Gornall, Kaplan, and Strebulaev, NBER Working Paper 22587, Table 6; published in the Journal of Financial Economics 135, no. 1 (2020). Figures are the authors’ reported averages of opportunities reaching each stage per closed deal; the funnel panel reports 442 responses. Survey evidence, not a representation of Connetic’s investment process or of universal practice.5
A compelling founder story is not an investment conclusion. It is the beginning of the research.
Structure Decides What You Hold
Direct interests, LP interests in a fund, diversified vehicles, and secondary transactions are not four routes to the same exposure. They carry different governance rights, fee layers, valuation practices, tax reporting, transfer restrictions, and liquidity constraints. Net asset value, portfolio-level secondary pricing, the price of an individual security, and a tender offer are four different concepts, and moving a figure from one to another is how mistakes get made. A vehicle may operate a defined repurchase program and still limit redemptions. Daily NAV calculation is not daily redeemability.
None of that is an argument against private markets, and none of it is specific to any one geography. An investor who has widened the map and skipped the structure has not built a durable path. They have built a longer list.
Which leaves the question this issue does not answer. More capital is being organized locally than a decade ago, and less national capital is arriving. Is that a market still forming, or a market being routed around? The data available today supports the question better than it supports either answer.
This commentary is educational and is not investment advice, an offer to sell, or a solicitation to buy any security. It does not recommend any investment, geography, manager, or structure, and nothing in it is a forecast of any market or an indication of future results.
- “Midwest startup funding Q2 2026: $1.27 billion across 114 deals,” Start Midwest, July 12, 2026, https://www.start-midwest.com/news/midwest-startup-funding-q2-2026-1-27-billion-across-114-deals. 114 reported rounds, 6.0% of US deal count, and $1.27B, 0.90% of reported US funding; Q2 2025 comparison shares were 6.4% and 7.4%. The publisher covers Illinois, Indiana, Michigan, Minnesota, Ohio, and Wisconsin and draws on Dealroom. Figures are presented as reported and may be revised.
- Start Midwest’s 2025 year in review and quarterly reports supply the five-quarter totals: Q3 2025, Q4 2025, Q1 2026, and Q2 2026. Q2 2025 included a $2.1B Acrisure financing; Q2 2026 included a $650M Slate Auto financing and a $67M Spectrum Brands public-company convertible note. Timing and classification can change totals.
- Christopher Wink, “Startups are spreading. Scaling remains concentrated,” Technical.ly, June 7, 2026, https://technical.ly/entrepreneurship/startups-are-spreading-scaling-remains-concentrated-builders/, reporting on LinkedIn data and Kauffman Foundation research. Business-formation volume and founder-connection density are as reported in that article. The author’s hedge is retained wherever the finding is used.
- Louis Lehot, Foley & Lardner LLP, in the National Law Review, August 17, 2026, https://natlawreview.com/article/venture-market-not-recovering-it-reorganizing, drawing on PitchBook data: funds of $1B or more captured 68.3% of H1 2026 US venture fundraising versus 36.1% a year earlier. This is national fundraising by fund size, not deployment by company location.
- Paul A. Gompers, Will Gornall, Steven N. Kaplan, and Ilya A. Strebulaev, “How Do Venture Capitalists Make Decisions?” NBER Working Paper No. 22587, September 2016, Table 6, https://www.nber.org/papers/w22587; published in the Journal of Financial Economics 135, no. 1 (2020): 169–190. Per closed deal: 101 opportunities considered, 28 reaching a meeting with management, 10 reviewed with partners, 4.8 reaching due diligence, 1.7 offered a term sheet. Survey of 885 institutional venture capitalists at 681 firms; the deal-funnel panel reports 442 responses. Survey evidence; not a representation of Connetic’s investment process or of universal practice.
The September 10 session is an educational discussion and is not an offer to sell or a solicitation to buy any security. It is not the evidentiary basis for this article. VCAFX is a closed-end interval fund designed for long-term investors. It is not a liquid investment. See the important Fund disclosures below and read the prospectus carefully before investing.